Modeling the relationships between markets is sometimes underappreciated as a prerequisite to solid risk analysis. Market relationships reflect linkages between markets that represent key risk factors that are the fundamental building blocks of exposure reporting, Value at Risk, and other risk analysis. Some of these relationships are widely understood and agreed upon by trading market participants, for example:
- US natural gas locations trade as a basis to Henry Hub, and
- Forward foreign exchange rates and interest rates are tightly interrelated (referred to as “Interest Rate Parity”)
Other market relationships are more subjective and tend to be determined by a firm’s commercial strategy, the specific design of its risk reporting, and/or their proprietary view of how particular markets work. Examples of more subjective market relationships include:
- Modeling NWE Gasoil as an outright price or as a basis spread to Brent
- Modeling other PJM power hubs as independent outright prices or as basis spreads to Western Hub
This blog will explore some of the primary relationships between financial and physical markets. Watch for a future blog when we’ll take a more detailed look at flat price and basis risk within several energy markets.
Perspective Matters
Some of you may have seen the illustration, "View of the World from 9th Avenue" (also refereed to as "A New Yorker's View of the World"), in which Manhattan dominates, and the rest of the U.S. and neighboring countries fade into the background. Similarly, the following diagram emphasizes the energy and commodities markets (because they are more important to us!) The financial markets, which are actually much larger than commodity markets, are shown as a small portion of the diagram. (In this blog “financial markets” refers to equities, foreign exchange, and interest rates – not to energy derivatives such as futures and swaps.)
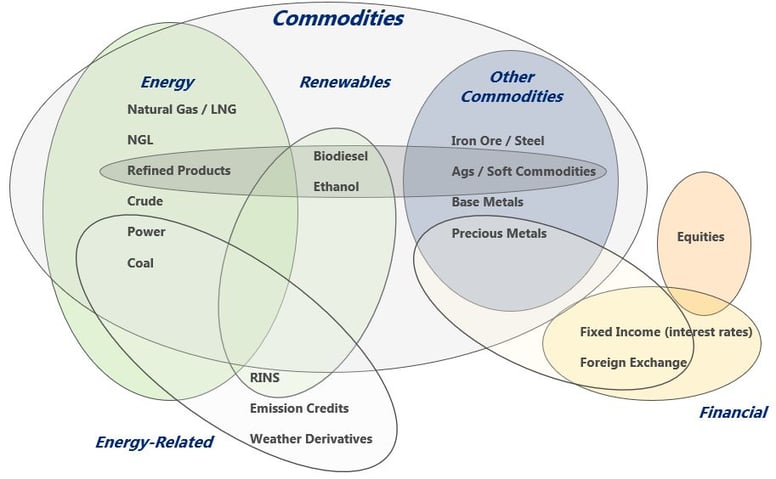
We’ll use this diagram to discuss market relationships. Circles represent markets that are related, such as related Energy products, as well as relationships between markets. These relationships vary by firm and should reflect how traders view the functioning of these markets. In many cases, traders arbitrage these physical and/or financial markets to maintain these relationships.
Examples of Market Relationships
Some examples of these relationships are described below. If your business transacts in these related markets, you should consider the alternative ways to report risk and which of those will serve your firm best.
- The difference between the price of low-sulfur commodities (e.g. fuel oil or coal) and high-sulfur commodities can be related to the value of sulfur emission credits. Some risk managers prefer to see a position in a low-sulfur coal as equivalent to a position in high-sulfur coal plus emission credits.
- Biodiesel and ethanol market values are related to both the value of standard refined products (diesel and gasoline, respectively) and to associated RINS that accrue to their producers. They are often valued using both, e.g. biodiesel value equals the NYMEX HO contract plus D4 RINs. The “crush spread,” or price difference between renewable products and feedstocks, is one of the most volatile spreads in commodity trading, since it is a function of poorly correlated energy and agriculture markets.
- “Interest Rate Parity,” which was briefly mentioned above, defines the relationship between spot foreign exchange rates, forward foreign exchange rates, and the interest rates in both currencies. These markets constantly equilibrate to remain consistent and “arbitrage free.” For example, if 1-year interest rates for Brazil were 4% higher than in the US, and the current spot exchange rate was 4.32 BRL/USD, then you would expect the forward exchange rate to be about 4.15 BRL/USD (4% lower). Thus, if a US investor buys higher yielding Brazilian bonds and hedges them in the forward currency market, they expect to lose as much on the currency hedge as they earned from the higher interest rate.
- Forward prices for precious metals (gold, silver, platinum, and palladium) function in a similar fashion. In fact, many trading shops model them in a manner equivalent to foreign exchange. The generally held view is that forward precious metals prices are related to spot prices by the “cost of carry,” which is a strong function of interest rates, but actually consists of three factors. Using gold as an example:
Gold cost of carry = USD interest rate + cost of storage + gold convenience yield
The convenience yield represents the benefit (if any) of holding physical inventory instead of a forward position. Usually the cost of carry is positive and the gold forward curve is positively sloping (contango), which is equivalent to saying that interest rates plus storage costs exceed the convenience yield. - Interrelationships exist within many commodity groups. For example, European gasoil is sometimes modeled as a function of Brent prices, and some NGL’s can be modeled as functions of natural gas prices.
- Long term price exposures may be modeled differently than short term prices, and modeling may evolve over time. During the 1990s and 2000s, it was common to relate other long term energy prices to WTI. When WTI infrastructure near Cushing, Oklahoma, became bottlenecked, Brent began to replace WTI in this role.
Flat Price and Basis Risk
Another dimension underlying these markets is that some prices are more important than others. Key benchmark products or hub locations may influence the prices of other locations or product grades. Industry practice varies slightly by market, but price risk is usually associated with several components of price:
- Possible changes in the benchmark prices are called “flat price” risk, and
- Different products may be related to the benchmark, but trade at a slightly different price, referred to as a basis spread or basis differential. This basis represents supply and demand differences that may be related to locations, qualities, and in some cases transportation method or timing. Changes in this basis are called “basis risk.”
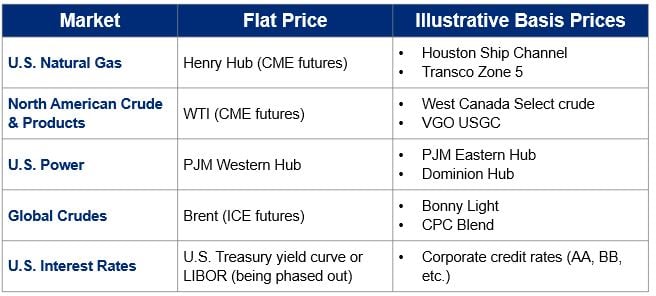
Several examples of flat price and basis risk in different markets are provided below.
Implications to Risk Reporting
These flat price and basis risks can be numerous in certain markets. U.S. natural gas basis locations number in the dozens, while global refined product trading organizations deal with hundreds or thousands of different basis prices.
The market relationships and price risk factors which are relevant to your firm constitute the “risk architecture” which should be designed into reporting. Without proper governance of risk architecture within each organization, reporting tends to be inconsistent and suboptimal at meeting the needs of the front and middle offices. For example, we recommend that P&L, exposure reports, and Value at Risk all be attributable to the same flat price and basis risks.
In Conclusion
Understanding relationships between markets is critical to proper risk reporting and management. Some relationships are subjective and will require policy decisions, which reflect your firm’s commercial strategies, imperatives, and market views. The Risk Management function is responsible for codifying these views in conjunction with Trading and the rest of the organization.
Standard industry practice dictates many of these relationships. However, as mentioned above, the practice of utilizing industry standards has limitations, and some firm-specific decisions must be made. In a future blog, we’ll discuss these details, as well as the process of determining how risk factors should be designed as the foundation for robust P&L analysis, risk reporting, and risk analysis.
At Veritas Total Solutions, our team of experts is versed in trading & risk advisory capabilities. We offer advisory services in commercial strategy, organizational structure and capabilities, and technology solutions. If you are interested in learning more about our capabilities, contact us to learn more or subscribe to our blog to stay connected!