
Among commodity trading organizations, there is an unexpectedly wide variety of internal credit risk analysis processes. Many firms measure less than is prudent given their business model. There is also an incomplete understanding of alternatives. In the first blog of the Credit Risk Series, we introduce some necessary terms and outline an overall credit risk management framework. In this blog, we’ll compare various common credit risk analysis methods. Future blogs will address other credit management topics including credit scoring, collateral management, and netting agreements.
Given the current economic climate in the upstream and downstream sectors of the energy industry, we believe credit risk management will become increasingly important over the next several years. It may be time to validate that your practices are meeting the underlying needs of your business.
Components of Credit Analysis
Credit risk exposure can be described in terms of analysis components that start with a foundation of Accounts Receivables, then add Delivered Unbilled, Mark to Market, and various Probabilistic credit risk estimates. The analysis complexity and sophistication of these components increase, and your business model should dictate how many are required. Each component is further discussed below. For the purposes of this blog, we will focus on gross credit exposures prior to netting any collateral or margin.
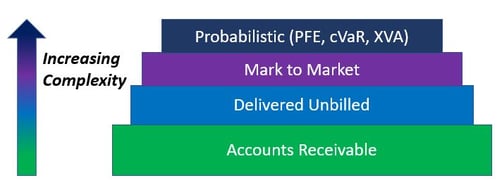 Illustration 1: Credit Risk Analysis Components
Accounts Receivable (AR)
Accounts Receivable (AR) is the foundational layer of credit risk measurement. These are the commodity deliveries or financial settlements for which the client has been invoiced but has not yet paid. Although all firms include AR in counterparty credit exposure, there are differences in the manner that late or missed payments are handled. Many systems assume that payments are made on time, and variations are handled on a manual, best efforts basis. Others raise automatic alarms and initiate mitigation measures immediately, such as preventing further transactions with the late counterparty. Your transaction volume should dictate your degree of automation.
Delivered Unbilled
Delivered Unbilled represents the value of commodities which have been delivered and title transferred, but not yet invoiced. One example is ratable physical natural gas deliveries during a month which are invoiced immediately following the month. During the month the credit exposure associated with Delivered Unbilled exposures increases somewhat ratably, is recategorized when invoices are generated, and then decreases abruptly when payments are made. This causes a complicated seesaw pattern of exposure as illustrated below, which is highly sensitive to payments. In this example, we have plotted historical (i.e. after the fact) Accounts Receivable and Delivered Unbilled over an 8-month period of ratable natural gas deliveries. One payment for the fourth delivery month was delayed, in order to illustrate its impact on total credit exposure.
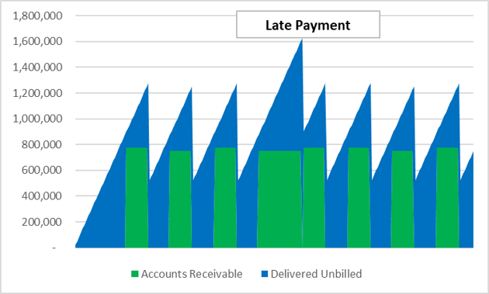 Illustration 2: AR plus Delivered Unbilled for Physical Sale
Mark to Market
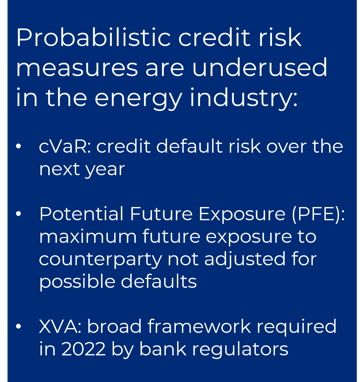
Transactions with positive Mark to Market value increase credit exposure. Even long or short basis positions can result in large positive Mark to Market values, as illustrated in the following example. Many energy firms focus on AR and do not include Mark to Market values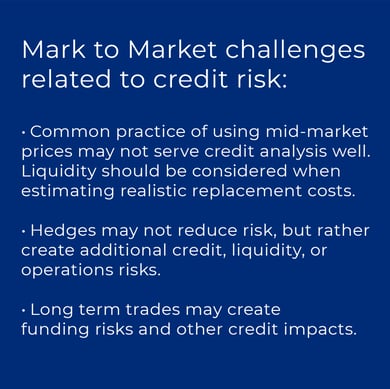 in credit exposure estimates. Depending on the nature of a firm’s trading positions, we believe it can be quite important to consider Mark to Market, particularly if long-dated transactions are part of your portfolio. However, there are several unique considerations when applying Mark to Market methods to credit risk analysis (see inset).
Following is an illustration of Mark to Market value within the credit exposure of a long-dated position, extending our previous example to include 4 months prior to the start of physical delivery. Note that this chart is also a plot of historical credit risk; i.e. it looks back at variations in credit risk after the fact.
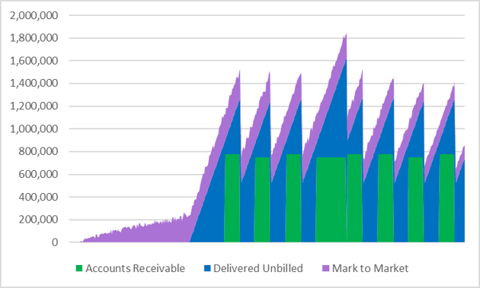 Illustration 3: AR, Delivered Unbilled, and Mark to Market for Physical Sale
This illustration demonstrates several characteristics of Mark to Market credit exposure:
- Positive Mark to Market increases credit risk, since it increases the financial loss that would occur if the counterparty defaults. Conversely, under some circumstances negative Mark to Market may reduce credit risk by netting against other credit exposure with the same counterparty.
- The contribution of Mark to Market to credit risk may be significant, depending on the nature of your firm’s trading positions.
- A peak Mark to Market exposure may occur due to the offsetting impacts of price changes and decreasing remaining position. This peak is easier to observe if the Mark to Market component is viewed in isolation, demonstrated in the following historical chart.
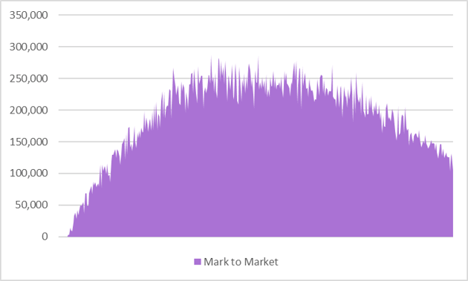 Illustration 4: Mark to Market Profile for Long-Term Physical Trade or Swap
Probabilistic Measures
Finally, there are several Probabilistic measures of credit exposure, which augment the other components. Whereas the others (Accounts Receivable, Delivered Unbilled, and Mark to Market) analyze current credit risk, Probabilistic credit analysis combines these with potential changes in credit risk over the next year or longer. There are several Probabilistic credit risk methods commonly used by banks and non-financial institutions:
- Credit Value at Risk (or cVaR) – an estimate of the minimum expected loss, usually evaluated over the next 1 year and 97% confidence level. cVaR incorporates the probability of default.
- Potential Future Exposure (PFE) – an estimate of future credit exposure including possible increases in Mark to Market over 1 or more years and a given confidence level. PFE is concerned with market movements and does not consider the possibility of a default.
- XVA – refers to a general framework of Value Adjustments, which banks are required to report under Basel III regulatory guidelines (aka “Fundamental Review of the Trading Book”) by 2022. XVA includes several adjustments for different types of credit risks. The primary adjustment is CVA, the expected value from any loss associated with one or more counterparties in the portfolio. Other adjustments are associated with one’s own credit, funding cost, regulatory capital requirements, and margin requirements.
Application of Probabilistic credit risk measures varies in our industry. Many energy firms and utilities do not use Probabilistic measures. Banks are required to use advanced credit analysis, and we have seen all three methods utilized. Since financial institutions will be increasingly required to use XVA, it is likely to become established as an industry best practice.
For this blog, we’ll use PFE to illustrate how Probabilistic credit analysis can be compared to other credit risk components. The previous illustrations of Accounts Receivable, Delivered Unbilled, and Mark to Market were historical charts. In order to illustrate PFE, we will imagine that the analysis was performed after 3 months looking forward at the balance of the transaction. At that time, the Mark to Market value would be expected to remain constant until physical deliveries start (and the outstanding position begins to decrease). PFE would estimate the possible increase in Mark to Market given a level of confidence, e.g. 95%, as illustrated in the following chart.
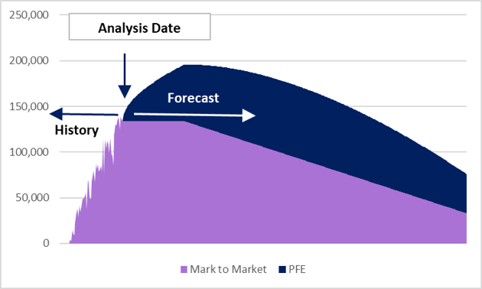 Illustration 5: PFE Estimate and Mark to Market
Now we will combine all four credit risk components, to visualize the Probabilistic contribution of PFE in excess of the other expected credit components.
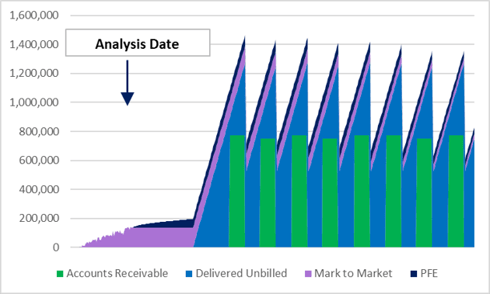 Illustration 6: Four Components of Credit Risk Analysis
For physical transactions involving large invoices, it is not uncommon for the credit risk contributions of Mark to Market and Probabilistic risk to be dwarfed by AR and Delivered Unbilled amounts (as shown above). The situation can be quite different for financial transactions, when credit risk related to Mark to Market and/or Probabilistic credit risk can be quite significant. This is particularly true for short options. An illustration for a multi-month financial swap is provided below, showing the dominance of Mark to Market and Probabilistic credit risk (and absence of Delivered Unbilled).
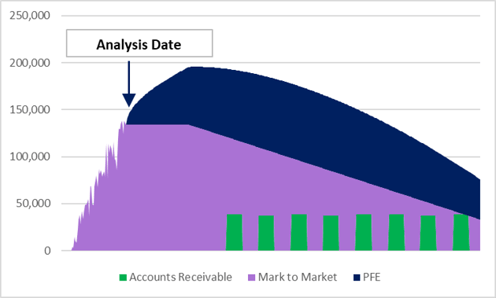 Illustration 7: Credit Risk Analysis for a Financial Swap
In Conclusion
We hope this overview has demonstrated the primary components of credit risk analysis. Unfortunately, given the current economic environment, credit downgrades and defaults are likely to increase. Veritas believes that credit risk management and the analysis behind it are likely to receive renewed emphasis.
When deciding the most appropriate analysis method for your firm, it is important to compare industry practices and the characteristics of your transactions including:
- What is your mix of physical and financial positions?
- Do you hold long-term sale or purchase obligations which include basis or other price risks?
- What is the credit worthiness and industry concentration of your counterparties?
- If your current credit analysis does not include Mark to Market or Probabilistic measures, should it be reevaluated?
More on Credit Risk Series
Obviously, there are a lot of details behind this summary, but we hope you find this organization of the subject helpful. Other blogs have (or will have) fuller treatment of the levels of credit analysis described above, as well as other related dimensions. These include:
- Credit risk management Overview - live!
- Credit scoring best practices – coming soon
- Credit risk management systems – coming soon
- Credit risk advanced analytics – coming soon
- Credit collateral management – coming soon
- Credit default and recovery risk – coming soon
As usual, don’t hesitate to contact us if you have other questions about this material, as well as alternative points of view.
At Veritas Total Solutions, our team of experts is versed in trading & risk advisory capabilities. We offer advisory services in commercial strategy, organizational structure and capabilities, and technology solutions. If you are interested in learning more about our capabilities, contact us to learn more or subscribe to our blog to stay connected!