This is the third in a series of VaR blogs. The first, Value at Risk: Overview and Benefit Case, provided an introduction to Value at Risk (VaR). The second, Successful Implementation of a VaR Solution, considered the unique challenges of VaR system implementations. This blog will address additional difficulties associated with risk management for refineries, chemical plants, and other commodity manufacturing or blending processes. We will consider the more complex risk management objectives of a plant, introduce the concept of a risk benchmark, overview several best practices, and address some practical implementation considerations. This blog is part of our VaR series because the approach we describe is required for VaR analysis of refineries, but we believe it is also needed for thorough economic analysis, performance measurement, and other exposure reporting associated with plants.
This blog is also a companion piece for a future blog on Refining Supply Chain Optimization, which will outline techniques to significantly improve refining margins through integration of trading and optimization processes.
Understand the Complexities in Refinery Risk Management
Most guidance on risk analysis begins and ends with simple examples, e.g. a long physical position and short financial hedge. The refinery risk management problem is more complex for several reasons:
- Refinery feedstock selections involve complex plant models and processes that are usually run weekly,
- Many crude feedstock and finished products are traded in global markets whose prices are volatile and vary every second,
- On the other hand, some crudes and products are illiquid and difficult to value,
- Distressed purchases (opportunities) and sales (crises) provide further complications,
- Unscheduled maintenance can disrupt plans and market obligations, and
- Refining operations are managed as continuous processes and volumes, rather than individual transactions.
In addition, there are organizational impediments to efficiently solving this problem – the interrelated activities of buying crude, optimizing the refinery schedule, and selling finished products are conducted by different teams. In most firms, the refinery optimization team and supply & trading organizations have different pedigrees and experiences. The typical optimization team is comprised of engineers whose careers were focused on refinery design and/or operation. In contrast, traders have spent years focused on markets, not optimization of a hydrocracker or distillation column. Sophisticated capabilities exist in both groups. Scheduling the best crude feedstocks and finished product manufacturing involves advanced linear programs or non-linear optimization tools. Trading involves real-time prices and complex trade terms, including spreads and options. However, these teams do not always understand one another well or have tightly integrated work processes and systems.
The rewards to solving this integration problem are significant. This blog describes the risk management foundation to improved integration between refining and trading. A future blog, Refining Supply Chain Optimization, will build on this foundation to demonstrate that gross margin improvements of 10-20% or more are possible through methods that are not widely deployed in industry. This is a new frontier, made possible by recent improvements in technology and in the understanding of integrated operations.
Establish Risk Benchmarks to Have a Comparison
In most textbook examples of hedging, it is clear what constitutes risk. A trade or physical position has market risk, and a financial hedge decreases or eliminates it. However, hedging and risk management of refineries and other plants involve more ambiguity.
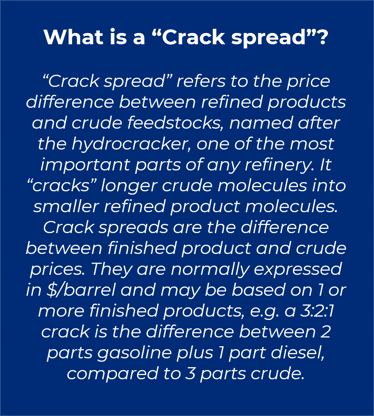
Legend has it someone once complained to Voltaire that, “Life is hard,” to which he responded, “Compared to what?” Refinery risk managers should ask a similar question, risk compared to what? Stakeholders usually expect certain price risk exposures associated with refineries, e.g. exposure to the refining “crack spread.” As crack spreads increase and decrease over time, these stakeholders expect profits to follow the same cycles.
However, the devil’s in the details. Most downstream energy firms correctly claim that their margins follow crack spreads over time. But different firms have different policies concerning the timeframe over which crude and products are priced and, therefore, how rapidly margins follow crack spreads. Some sell (and price) products when crude prices are determined. Others allow weeks or months between the period that a feedstock barrel is bought and when it is sold as finished product. Still, others sell crack spreads several forward months or even years into the future. In some cases, much discretion can be exercised by traders or commercial teams that manage the refinery.
For these reasons, we believe that firms should establish Risk Benchmarks for refineries and other commercial plants and incorporate their use within their governing risk policy. We will define a Risk Benchmark as follows:
A Risk Benchmark is the specific position against which actual exposure and risk are compared. The Risk Benchmark is policy-based but is specific enough to be actionable.
The establishment of a Risk Benchmark is often skipped or underappreciated because for many businesses the benchmark is “doing nothing.” For example, a stock investor may consider their capital at risk, compared to investing nothing. Alternatively, they may compare risk and performance to the S&P 500. Both views are valid, but for risk management purposes one primary view must be adopted. Other examples of potentially complex benchmarks are:
- Upstream production – should you hedge all, none, or the proportion required by bank covenants?
- Currency hedging – stakeholders may not need or expect all global earnings to be converted to a single “base currency”
- Refineries and other manufacturing plants – economic performance is generally tied to the spread between finished product and feedstock prices, but timing for when these prices are determined can vary greatly.
Veritas believes that the proper Risk Benchmark for a refinery is the spread between spot prices for feedstocks and finished products, applied to the actual volumes run and produced each day. We’ll further describe the development and use of this Benchmark below.
Optimize your Book Structure to Effectively Measure VaR
Before addressing Risk Benchmarks in detail, some housekeeping is in order. Veritas recommends disaggregating parts of the refining supply chain to improve performance measurement and management. This philosophy extends to exposure and risk analysis.
The activities which should be distinguished are:
- Crude trading
- Crude inventory
- Refining crack spread
- Feedstock and product volume forecasting error
- Finished product inventory
- Product trading
Usually, this is accomplished via “book structure” or a series of separate portfolios which hold trading positions, inventory, and refinery volumes (pictured below). P&L, risk, and risk-based performance are measured separately for each portfolio. In this model, Trading should be responsible for inventory price risk, while Refining or Operations will specify minimum and maximum inventory levels. Refining is responsible for the difference between forecast and actual volumes, including both scheduled and unscheduled maintenance.
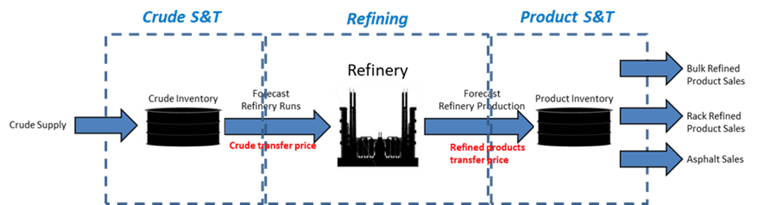
The transfer prices referenced above are the spot prices for feedstocks consumed and finished products produced each day, sometimes referred to simplistically as the “crack spread of the day.” Together, these constitute the refinery’s Risk Benchmark.
Some industry participants do not agree with this approach. It’s fairly common practice to see crude supply and/or product sales combined with and indistinguishable from refining economics. We believe this unnecessarily obscures supply and trading activities, making it difficult to assess their performance.
Start Measuring Performance Against the Benchmark in Preparation of VaR
Once the book structure and transfer prices described above are established, third party activities can be placed in the trading portfolios and their performance measured against the Risk Benchmark, as annotated below. In this example, the refinery buys actual feedstock volumes at current spot prices (1) and sells finished product volumes at spot prices (2). A 200,000 barrel/day refinery would receive the difference between product prices and crude feedstocks, multiplied by about 200,000 barrels/day (allowing for actual volume fluctuations). The crude trading book effectively sells forecast crude volumes for a daily spot price (3), and in this example goes long early in the month (buying more than they sell) because they believe prices will strengthen (4). Conversely, the product trading book buys forecast products at spot prices (5) and sells according to its price outlook (6). In this example, product trading defers sales until later in the month, also creating a net long position at the beginning of the month. Note that both trading groups are net long at the beginning of the month (7 and 8) – risk management professionals jokingly call this a “Texas hedge,” meaning that we’re long everything.
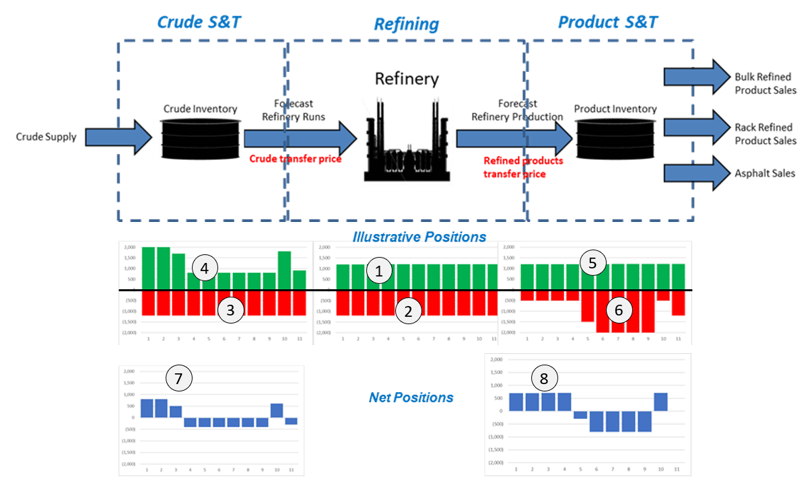
Note that these net positions are specific because the Risk Benchmark is specific. The refinery will receive the spot crack spread, adjusted for differences between actual and forecast volumes (and this “forecast error” can be separately reported). Trading’s performance will be relative to the volume-weighted average price of crude or product.
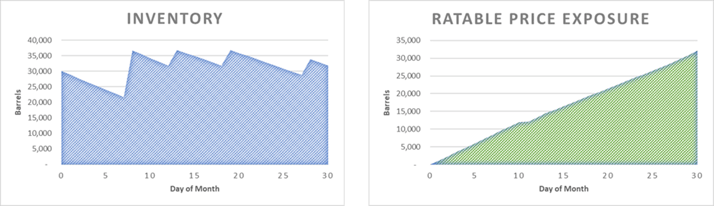
Make Sure to Manage and Benchmark Inventory Risk Properly
Inventory price risk management deserves special mention because it is often confused with physical inventory. Physical inventory can be managed independent of its price risk. Physical inventory needs are driven by scheduling activities, operating requirements, minimum and maximum safety levels, maintenance, etc. The price risk associated with inventory can be hedged and separately managed, as illustrated below.
For the purposes of this blog, “price risk” refers generally to flat price and/or basis risk. For some commodities, grades, and locations, it is not possible to perfectly hedge both with financial instruments. However, many feedstocks and products that cannot be exactly hedged with financial products can be managed reasonably well with a “proxy hedge” that uses related products.
We believe that inventory price risk should be managed within Trading books (portfolios) since traders are better equipped to transact financial hedges. In contrast, the inclusion of inventory price fluctuations in the Refining book has the undesirable effect of producing noise and interfering with accurate performance and risk measurement.
Take Transformation Needs into Consideration During Planning
Implementing a Risk Benchmark, as with any new or enhanced business capability, requires attention to:
- People – hiring and/or training the required staff and executive team,
- Process – agreeing and documenting processes and policies to govern the new activity, and
- Technology – systems to provide a reasonable level of automation, once processes are well understood and stabilized.
Different levels or phases of execution are possible. It is not advisable to attempt too much with the initial project. For example, complex options or other advanced features can be implemented in a subsequent phase. The first step in any Risk Benchmark project should be a Planning effort during which a project roadmap is developed and approved.
In Summary
We have explained why refinery risk management requires a Risk Benchmark, and we have defined and illustrated its use. We believe best practice is to base refinery economics upon the spot crack spread, and for feedstock and product trading to be compared with these same prices and volumes. We recommend that book structure be used to segregate activities and provide better measurement and management of trading and refining. A case was also made for separating physical inventory from inventory price risk management.
For more information on utilizing this framework to better monetize the optionality in your refinery or plant, watch for our future blog, Refining Supply Chain Optimization.
VaR Series
Check out the other blogs part of the VaR Series.
At Veritas Total Solutions, our team of experts is versed in VaR and other trading & risk advisory capabilities. We offer advisory services in commercial strategy, organizational structure and capabilities, and technology solutions. If you are interested in learning more about our capabilities, contact us to learn more or subscribe to our blog to stay connected!