The VaR Mystique
Value at Risk (VaR) is surrounded by mystique and confusion in the Commodity Trading and Risk Management industry. This confusion complicates its use, due to challenges such as governance, development of organizational capabilities, and the implementation of tools. Confusion about VaR is unnecessary and can be overcome with a proper approach and framework. To help bring clarity to this topic, we will discuss VaR best practices in a series of blogs, beginning with this overview.
First, we should define VaR. A great deal of confusion is caused by ambiguous, but widely used, definitions. Most common VaR definitions are similar in form to that suggested by Philippe Jorion (Value at Risk, 1st edition 1996):
VaR summarizes the worst loss over a target horizon (e.g. 1 day) that will not be exceeded with a given level of confidence (e.g. 95%).
To a mathematician or statistician, this is precise language that hinges on the term “level of confidence,” but most practitioners focus on the term “worst loss” without considering the confidence interval, which can lead to misunderstanding. VaR does not inform you of maximum loss. We suggest a clearer definition:
VaR is the estimated loss for a specific quantile (e.g. 5% worst case), over a time horizon (e.g. 1 day).
In other words, VaR may estimate the loss for which 5% of scenarios are worse, and 95% of scenarios are better. It is not the worst case. Given that a typical calendar month has approximately 20 trading days, one can expect that one day each month may be worse (1 in 20 days equals 5%). Note the very different emphases in these definitions: the more cautious “estimated loss” vs. statistically correct, but misleading, “worst loss ... with a given level of confidence.” We believe the former is much more clear and provides greater transparency about what a VaR metric represents.
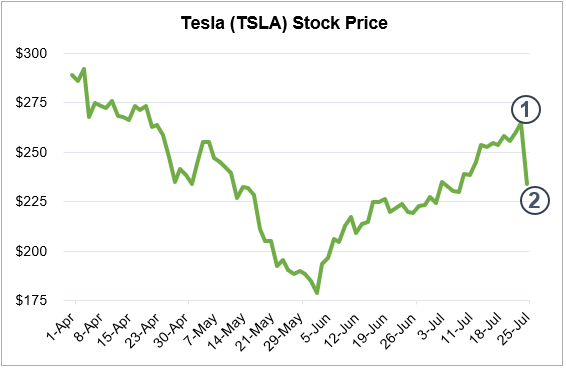
An example may illustrate further. If you own shares of a highly volatile stock, such as Tesla, its annualized price volatility is about 50%. By convention this means that daily price changes have approximately a 3% standard deviation (50% divided by the square root of 250 trading days/year). Based on a current $228/share price, daily VaR at a 95% confidence level is approximately $12/share (almost twice the daily standard deviation).* This means there is a 5% chance the stock will decline more than $12/share each day. In these worst cases, which may occur approximately 1 in 20 days, $12/share is the minimum loss we expect. Such a move is illustrated in the following chart from day 1 to day 2, as annotated. It is important to note that this observed daily loss is substantially larger than the $12/share loss predicted using the 95% confidence level. In this case, on July 25 share prices declined nearly $40/share.
Consider this example in light of the definitions of VaR we compared. Given the $40/share loss on this day, characterizing the $12/share VaR estimate as a “worst loss” seems misleading.
*VaR practitioners will recognize that the mathematics in this example are based on an assumption that stock price returns are log-normally distributed, and that 1.65 standard deviations represents a 95% confidence level. It is widely known that for most financial markets, log-normal distributions tend to underestimate the likelihood of extreme price movements. Nevertheless, such use of statistics has been somewhat standardized in the industry, with full recognition of its limitations.
A Brief History of VaR
It is instructive to review how VaR has evolved over time as a function of industry use and financial regulation, in order to understand how and why it is used today.
Financial market volatility and risk increased dramatically between the 1970s and 1990s. Several contributing events included the 1971 "Nixon shock" (in which the U.S. discontinued the fixed dollar-to-gold conversion), the oil price shocks during the 1970s, the stock market Black Monday in 1987, and the Japanese stock bubble in 1989. The use of financial derivatives increased significantly in the 1970s and 1980s, in part to manage the risk of these more volatile markets. In turn, risk analysis received increasing attention.
Private industry, led by the financial sector, proactively developed risk measures and practices to preempt regulation. J.P. Morgan is credited with coining the term Value at Risk, which the Group of Thirty (G30) first publicly promoted in a 1993 report. The following year, J.P. Morgan published the seminal RiskMetrics Technical Document, detailing the process and mathematics of calculating VaR, and free online data was provided to foster its use. Accounting standards and other regulations followed, based upon best practices that were developed by the financial industry. Regulation of commercial banks included the original Basel Accord (also known as Basel I), followed by Basel II. These promoted VaR as a part of sound risk analysis methods.
Looking to the future, financial industry technology and regulation generally leads that of the commodity industry. To predict best practices in commodity risk management, one has only to observe what is currently being utilized in the financial sector. For example, new banking standards referred to as Fundamental Review of the Trading Book (FRTB), are being revised and implemented by 2022, which will further evolve standards for risk analysis and reporting.
A Case for VaR
The use of VaR is not without controversy. Like many financial analysis techniques, it has limitations and shortcomings. VaR was the subject of a very public debate between Jorion and Nicholas Taleb (best known for his 2007 book, The Black Swan). Among other criticisms, Taleb argued that VaR incorrectly estimates the risks of rare events, creating false confidence. Others have argued that the use of VaR led, in part, to the 2007-2008 financial crisis. Jorion emphasized the following point in defense of VaR:
The greatest benefit of VAR lies in the imposition of a structured methodology for critically thinking about risk. Institutions that go through the process of computing their VaR are forced to confront their exposure to financial risks and to set up a proper risk management function. Thus the process of getting to VAR may be as important as the number itself.
In the spirit of Jorion’s views, a well-considered implementation of VaR analysis will stimulate informative discussion of your firm’s business objectives, yielding significant benefits such as:
- Agreeing on a framework for evaluating the risks to which your business is exposed, such as the relationships between various commodity flat price and basis risks;
- Insights to the relative riskiness (and “risk efficiency”) of different trades and trading strategies;
- Organizational alignment on the nature of risk and the mathematics of its measurement; and,
- Increased transparency and internal communication about market risk.
VaR Series
Check out the other blogs part of the VaR Series that address the details of successful VaR analyses and projects.
At Veritas Total Solutions, our team of experts is versed in VaR and other trading & risk advisory capabilities. We offer advisory services in commercial strategy, organizational structure and capabilities, and technology solutions. If you are interested in learning more about our capabilities, contact us to learn more or subscribe to our blog to stay connected!